Vibration testing
“resonances shift as material fatigues
and for the test to be valid, the test
frequency also needs to shift. ”
AEROSPACETESTINGINTERNATIONAL.COM // SHOWCASE 2020 77
reasoning, engineers would often set the
default phase difference setting for a
resonance to 90o.
However, the real phase difference may
be quite different from this theoretical 90o.
First, the initial phase measurements may
be affected by the location of the
accelerometer or by a lag in the
instrumentation reading. Second, the
phase differences may shift due to changes
in test amplitude or non-linear response
wto fatigue.
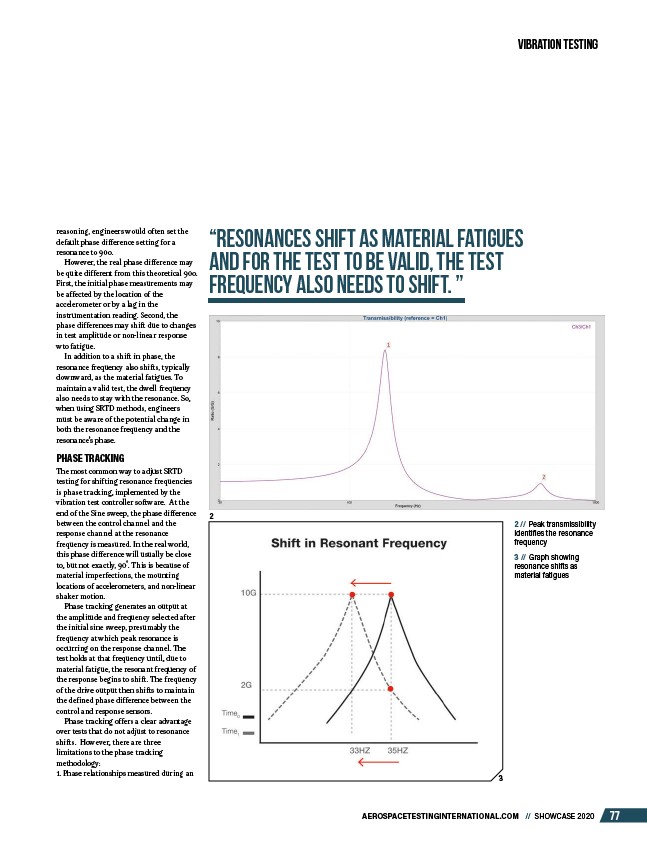
In addition to a shift in phase, the
resonance frequency also shifts, typically
downward, as the material fatigues. To
maintain a valid test, the dwell frequency
also needs to stay with the resonance. So,
when using SRTD methods, engineers
must be aware of the potential change in
both the resonance frequency and the
resonance’s phase.
PHASE TRACKING
The most common way to adjust SRTD
testing for shifting resonance frequencies
is phase tracking, implemented by the
vibration test controller software. At the
end of the Sine sweep, the phase difference
between the control channel and the
response channel at the resonance
frequency is measured. In the real world,
this phase difference will usually be close
to, but not exactly, 90˚. This is because of
material imperfections, the mounting
locations of accelerometers, and non-linear
shaker motion.
Phase tracking generates an output at
the amplitude and frequency selected after
the initial sine sweep, presumably the
frequency at which peak resonance is
occurring on the response channel. The
test holds at that frequency until, due to
material fatigue, the resonant frequency of
the response begins to shift. The frequency
of the drive output then shifts to maintain
the defined phase difference between the
control and response sensors.
Phase tracking offers a clear advantage
over tests that do not adjust to resonance
shifts. However, there are three
limitations to the phase tracking
methodology:
1. Phase relationships measured during an
2 // Peak transmissibility
identifies the resonance
frequency
3 // Graph showing
resonance shifts as
material fatigues
2
3
/AEROSPACETESTINGINTERNATIONAL.COM