Vibration testing
“a test engineer must be able to
adjust for shifting frequencies
and shifting phases in a
product’s resonance”
initial sweep are imprecise.
2. If the product has a non-linear amplitude
response, a change in amplitude between
the detection portion of the test and the
dwell portion of the test may result in both
a different resonant frequency and a
different phase relationship.
3. Fatigue may behave in a non-linear
fashion, causing the phase difference at
peak transmissibility to change as fatigue
effects progress.
PEAK TRACKING
This is another option for adjusting to
resonance shift during the dwell portion of
a test. Peak tracking allows the controller
to adjust both the output frequency and the
phase difference between the two channels
to maintain peak transmissibility. Phase
adjustment works by constantly oscillating
the phase difference between the control
and the response channels and observing if
the transmissibility increases or decreases.
The algorithm controlling the oscillations
learns the shape of the transmissibility
graph and seeks the peak; as the algorithm
learns more, the amount of phase change
continues to decrease.
Peak tracking minimizes the need for
precise detection during the sine sweep, so
4
78 SHOWCASE \\ AEROSPACETESTINGINTERNATIONAL.COM
users can sweep faster. More importantly,
it ensures that peak transmissibility is
maintained throughout the dwell portion
of the test, even when phase relationships
shift along with the resonance frequency.
EXPERIMENTAL COMPARISONS
The difference between peak tracking and
phase tracking was demonstrated in the
following experiment., Forty SRTD tests
were conducted on notched aluminum
beams (4 x 0.5 x 0.125in) (Figure 5), twenty
using peak tracking and twenty using
phase tracking. One end of the aluminum
beam was attached to a shaker head and a
mass hung from the cantilevered end of the
beam (Figure 6). A sine sweep of 1G across a
frequency band of 60-120Hz was
performed.
The tests were all controlled by
VibrationVIEW software from Vibration
Research, which offers both Phase
Tracking and Peak Tracking options for
SRTD testing.
RESULTS
The test results are separated into two
groups because slightly different
procedures were conducted.
1. Sweep rate and direction: 3 Oct/min;
sweep down
Fourteen aluminum beams were tested
(seven with phase tracking and seven with
peak tracking). The rate of 3 Oct/min
generally produces a fairly accurate
original sweep.
The average time to failure was 20.91 min
for peak tracking and 23.88 min for phase
tracking, an increase of 14.20%.
2. Sweep rate and direction: 6 Oct/min;
sweep up
Here, 26 aluminum beams were tested
(13 with phase tracking and 13 with peak
tracking). The sweep rate of 6 Oct/min and
sweep up methodology probably did not
produce as accurate a resonance frequency
and phase value as determined using a
slower sweep rate.
The average time to failure was 33.15
minutes for Peak Tracking and 37.50
minutes for Phase Tracking, an increase
of 13.12%.
The experiment clearly shows that peak
tracking causes faster product failure than
phase tracking.
To obtain the most precise location of a
resonance, a test engineer must be able to
adjust for shifting frequencies and shifting
phases in a product’s resonance due to the
changing characteristics of the product as
it fails. Peak tracking SRTD provides the
test engineer with the tools to accomplish
this. Other SRTD methods only allow one
variable to shift, and consequently, the
engineer may not be testing at the peak
resonance. \\
Joel Minderhoud is a research scientist at Vibration
Research
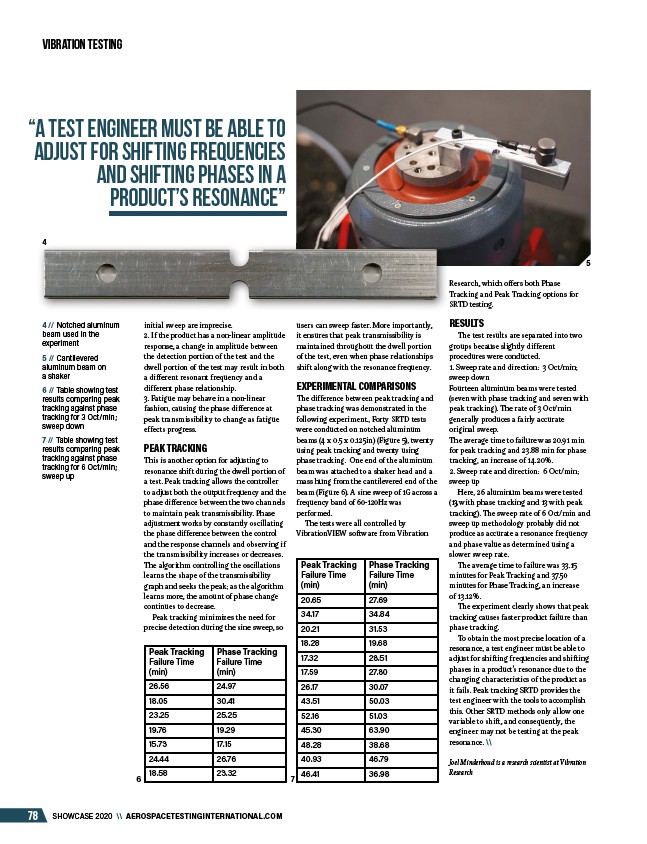
4 // Notched aluminum
beam used in the
experiment
5 // Cantilevered
aluminum beam on
a shaker
6 // Table showing test
results comparing peak
tracking against phase
tracking for 3 Oct/min;
sweep down
7 // Table showing test
results comparing peak
tracking against phase
tracking for 6 Oct/min;
sweep up
Peak Tracking
Failure Time
(min)
Phase Tracking
Failure Time
(min)
26.56 24.97
18.05 30.41
23.25 25.25
19.76 19.29
15.73 17.15
24.44 26.76
18.58 23.32
Peak Tracking
Failure Time
(min)
Phase Tracking
Failure Time
(min)
20.65 27.69
34.17 34.84
20.21 31.53
18.28 19.68
17.32 28.51
17.59 27.80
26.17 30.07
43.51 50.03
52.16 51.03
45.30 63.90
48.28 38.68
40.93 46.79
46.41 36.98
5
6 7
/AEROSPACETESTINGINTERNATIONAL.COM