fleet movement and downtime data to show
where these could be optimally placed.
“There are more than 500 charge points in
London, but we found that most vehicles didn’t
stop for long enough or close enough to use
them,” says Scott. “Then it dawned on
us that we could flip this round by
positioning charge-points based
on actual fleet operations.”
Only 1% of tracked vehicles
stopped within 100m of
existing charge points, but
Ford estimate as few as 20
new rapid charge points
in strategic locations could
significantly improve EV
viability across the whole
of Greater London. Ford
believe automated chargepoint
positioning will interest
not only London’s city planners
but municipalities across the world
regulating to reduce urban emissions.
Getting people onto public transport is
central to London’s transport strategy and, as
with fleet retiming, Ford vehicle data provided
route-specific evidence of the potential benefits.
Comparing journey times from Ford’s Fiesta
fleet with multi-modal API data and transit
timetables revealed that 20% of driven journeys
would be quicker by public transport, cycling
or on foot. A web application developed by
Ford to enable journey-time comparison offers
a potentially powerful tool for encouraging
people to shift modes. Such information could
also allow authorities to target public transport
| SMART DATA
investment on routes where transit times
compare less favorably with driving.
Surprises on the road
Vehicle data provides potential to develop
a nuanced understanding of traffic flow
across a city. As part of its project,
Ford set out to interrogate the socalled
‘summer holiday effect’:
the assumption that roads
will be less congested
during academic recess. By
measuring actual vehicle
speeds against speed limits
on a road-by-road basis,
they compared traffic flow
across London in a normal
week with a week in the
holidays. While a lack of
school-run traffic was shown
to improve travel-times in most
areas, congestion on certain roads,
including the A13 and A406 North
Circular, actually increased during the holidays.
“Granular data allows you to look at shorter
lengths of road across time,” says Scott. “This
offers the ability to focus increasingly scarce
resources on the most challenging sections
of the road network.”
Having created a snapshot of how data from
just 160 vehicles could serve to optimize a city’s
transport system, Ford is ready to engage with
authorities worldwide and has already extended
its data analysis to Valencia in Spain and Cologne
in Germany. Armed with predictive analysis,
Ford is now working with civil engineers at
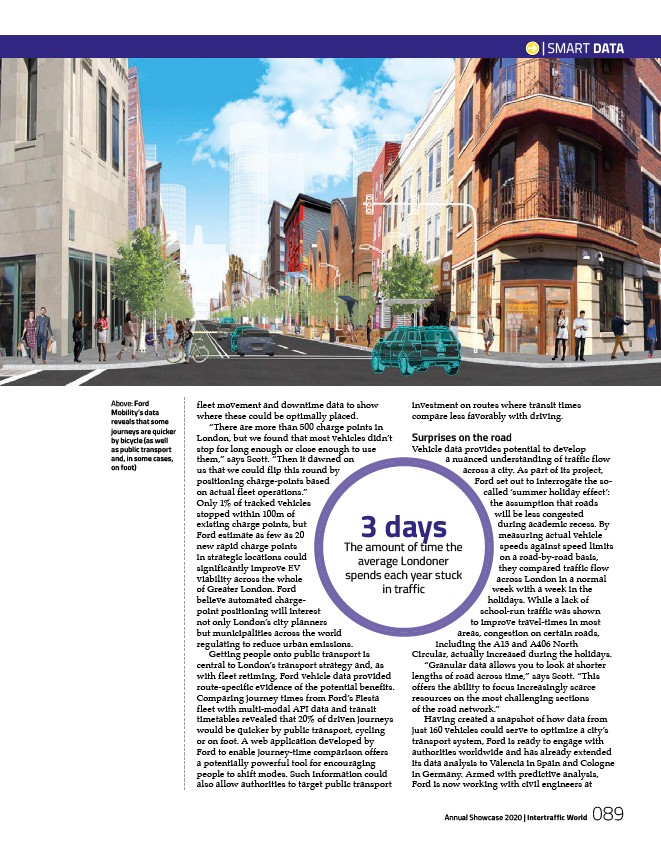
Above: Ford
Mobility’s data
reveals that some
journeys are quicker
by bicycle (as well
as public transport
and, in some cases,
on foot)
3 days The amount of time the
average Londoner
spends each year stuck
in traffic
Annual Showcase 2020 | Intertraffic World
089